Generating 1:1 ipfix from 10g pipeline - Getting the data - Part 1
Goal : generate lossles ipfix flow's from distributed pipe to monitor application or network performance, identify bootlenecks and generate alerts if possible.
Why this way ? : It was expensive to do it with proprietary solutions. Plus we needed to have a flexible, open source option to work on. The closest solution cost was $1M
Challenges ;
- We are going to do it using cpu, so lot's of flows require lots of processing power,
- short flows create large ipfix messages than theirselves, any dns flow is is mostly 100 bytes long but a ipfix message for that flow costs us 1000 bytes
- many packets traversing the kernel would create losses so we needed to bypass that
- we need to create custom dashboards, or create alerts.
- deduplication
Plan :
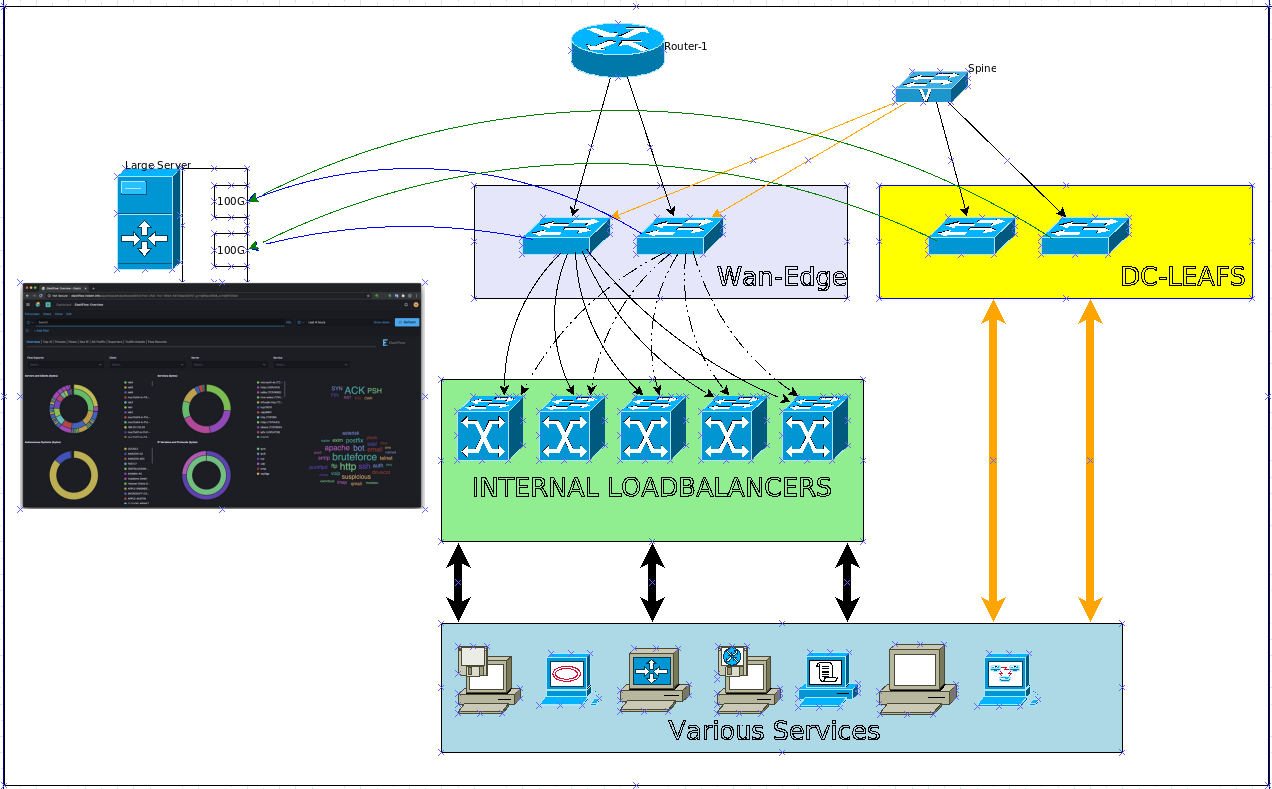
- get mirrors from devices
- produce ipfix from mirrors
- send ipfix data to elastiflow
- design custom dashboards
- design monitor and alerters
What happened along the way;
- Obviously there will be lot's of storage requirement and cpu requirements how ever the current write rate wasn't going to be deadly so we decided to go with using only one server with many ssd drives. We lost the array drives because of a failure in array controller
- We were going to aggregate mirrors from fabric using a Mellanox switch by utilizing it's bridge functions, the asic couldn't manage packet replication this step failed, we bought additional cards and skipped aggregation layer.
- The intel x810-CAQxx cards failed to go in Zero Copy mode, we needed to wait for 2 months for a new firmware from intel
- The tool that we used created problems with intel cards firmware and kernel module. We had to reflash them twice till we found a working state
- The tool had a bug with combining mirrors so we waited for a bugfix.
Current status
We have a working setup, using
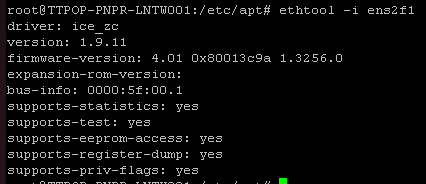
this version of intel module

With this version of firmware
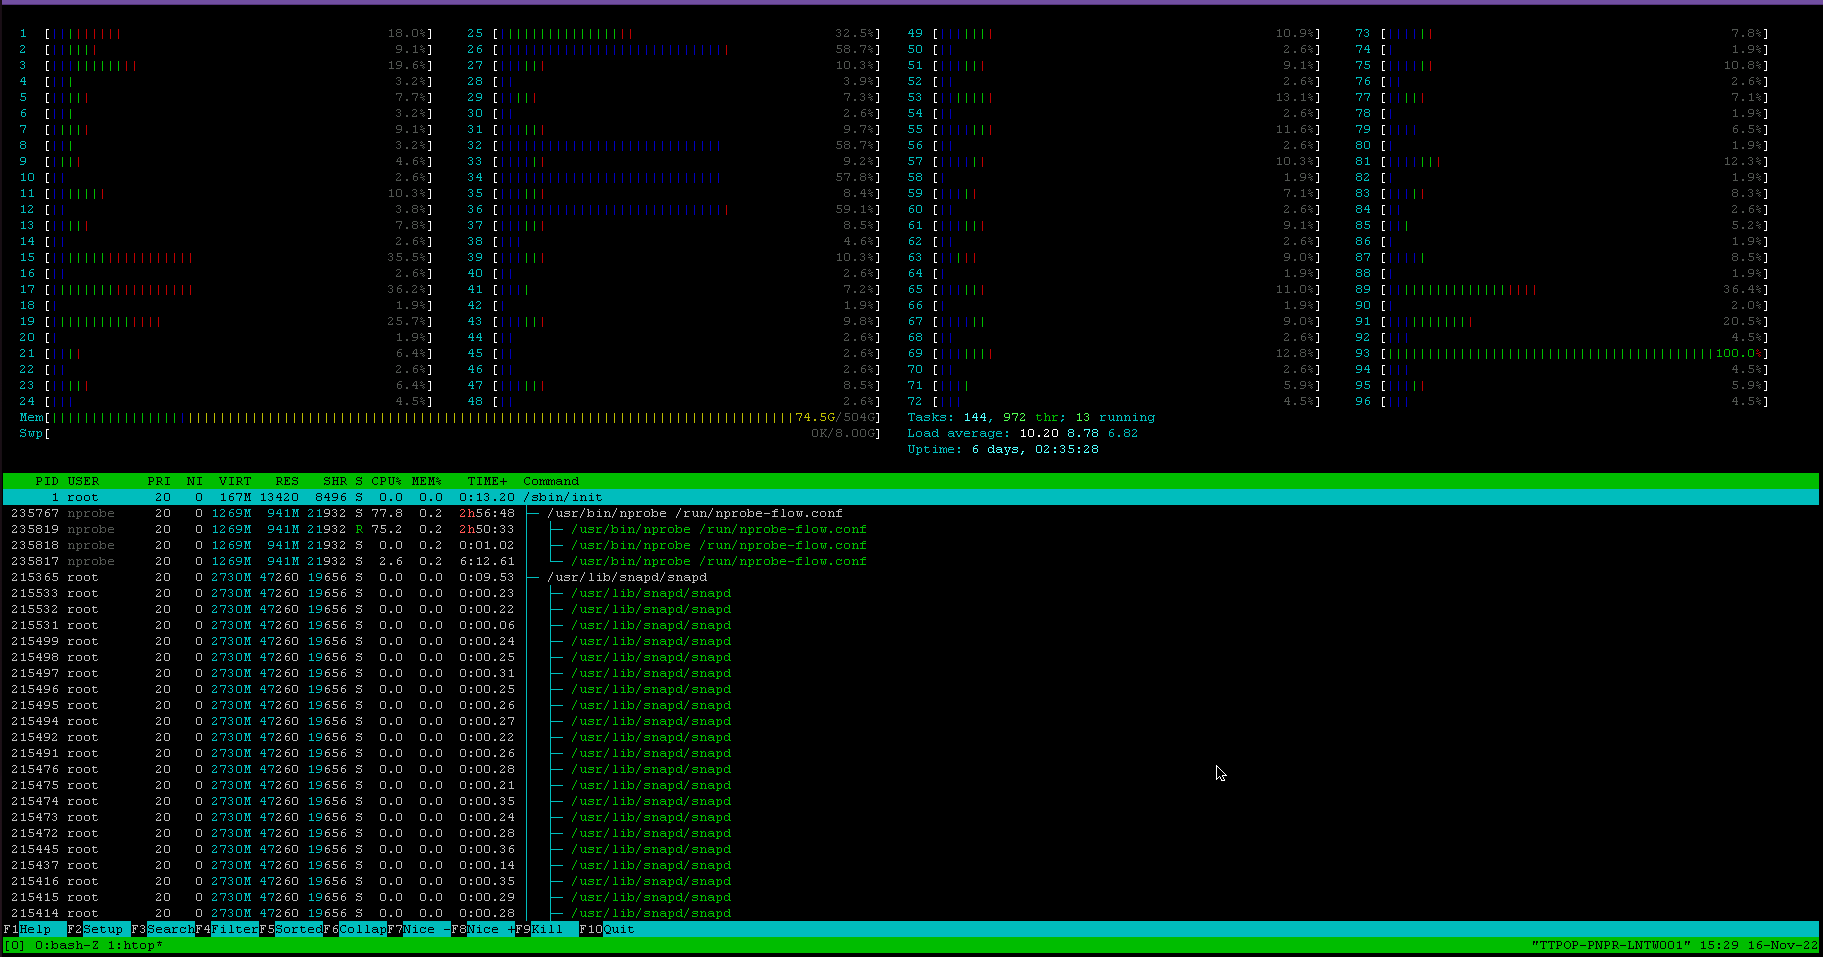
You can find some performance outputs as shown below
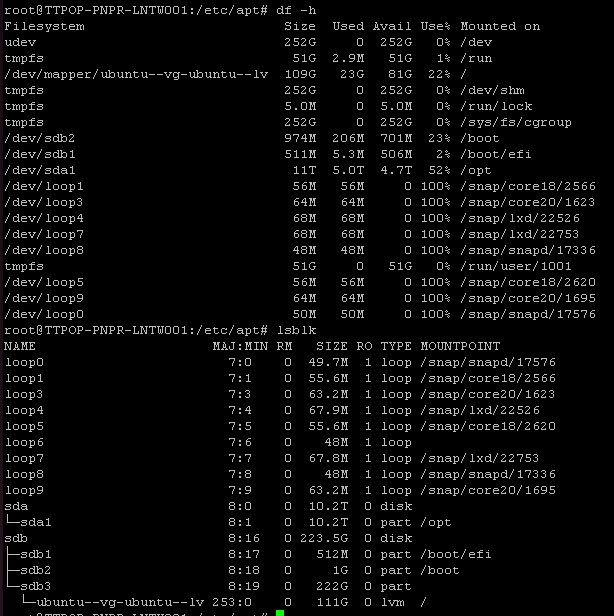
Disk config
What's Next:
Well, we started to deep dive into traffic and analyze, create widgets and all the necessary stuff to have a Management dashboard. We saw some interesting stuff too which will need a lot of troubleshooting and investigation.


No comments to display
No comments to display