Misc
- Terminating bgp with apipa blocks on firewalls - Avoid at all times -
- Wazuh Cheat Sheet
- Gns3 as a daemon on 22.04
- Tutundurma süreci
- SDS
- Nopasswd the user
- Freeradius 2fa with ldap and google
- Bgp Evpn vxlan Case Documentation
- 100 kb over 20ms delayed link with smbv3
- ETL as a service
- Citrix Automated Reporting
- PBS Tests
- NE assesement
- System Requirements Specification (SRS)
- extender Daemon
- Reset usb and enable bluetooth
- Cisco Router Automation with Ansible
- Proto Analyzer
- pipes
- Mercanın projeleri
Terminating bgp with apipa blocks on firewalls - Avoid at all times -
The problem
[Day 1]
Today i got lost in sophos firewalls internal routing and nat labyrinths, what i was trying to do was a simple LDAP integration to a server ath the end of a vpn tunnel. For interoperability reasons with AWS networks, we did used the famous "APIPA" block ip addresses on our bgp neigborship design.
But, there is catch !
There is always a catch and sometimes a group of catches. Windows server machines won't route or process apipa address ranges. Блять right ? Anyway my options were clear
- Change the addressing on ipsec links
- Snat the connections getting out of the firewall
Here is the topology i was dealing with.

i got close
I thought that amazon must have a sound reason to use these blocks on their integrations. I am sure they never thought the apipa addresses were going to be used as source addresses on production links, or the CPE's might have limitations too.
I know that Fortigates have the option to specify source addresses for control plane operations however sophos doesn't have them. _insert sad emoji here _
there is one
Ok, i can always use the snat option right ? So i went with option 2 on my list.
And after two hours mangling with it i gave up and created a case, which got the required attention immediately from sophos, since the traffic is generated from firewall itself, a special snat entry was not going to be processed as i expect.
Apparently Postrouting operations weren't processed on control plane chains, and i really don't wanted to go with option 2 so a very capable and gentle guy from sophos tried helped me however we couldn't got the golden ticket today !
I did spent 3 hours working on this case learned many things about how kernel processes encrypted packets and found out good documents about how packets traverse when they are using xfrm framework. i am going to add the things i read at #further reading section below.
And will update this page on next update i get.
Further Reading
How to use snat with xfrm if had a vyos
This image from the post above displays the packet flow mech on linux.
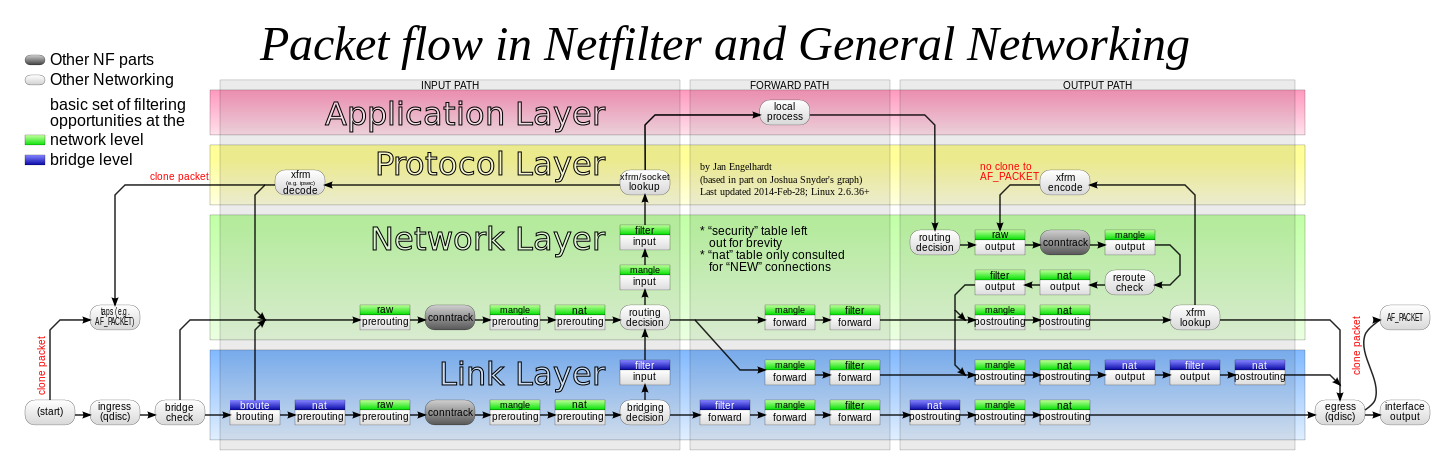
Strongswan xfrm implementation
The solution
[day 5]
Apparently, there is a special section to add nat entries for "System Generated Traffic", and it is only accessible to command line interface. To do that you have to access the firewall through console using ssh and go to advanced menu as shown below.
Then you will have to type
cish
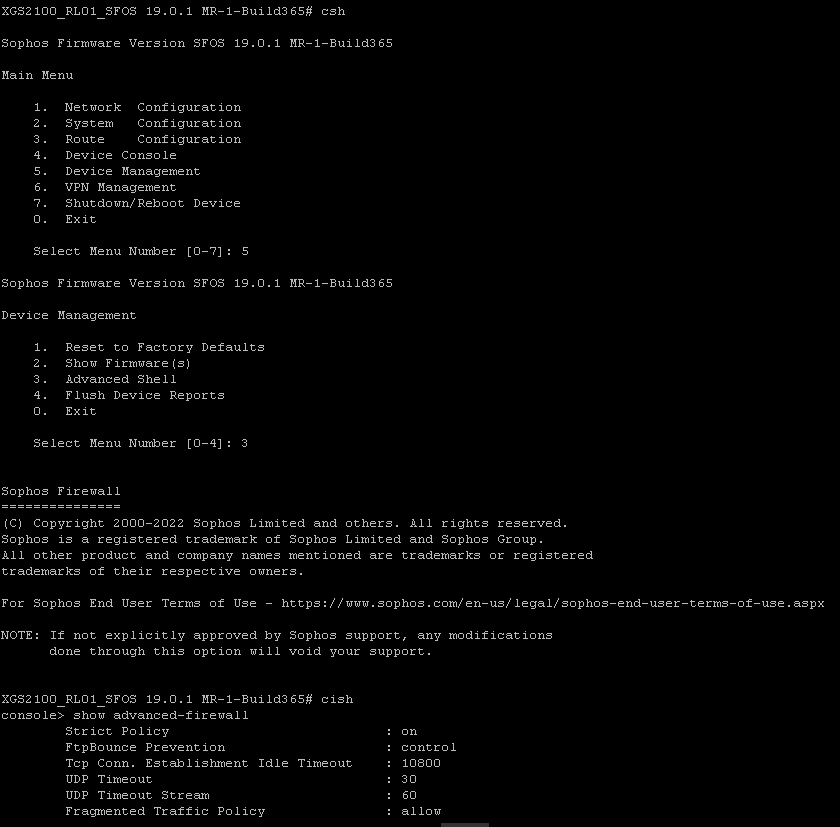
then you'll have to add a nat entry as shown below
set advanced-firewall sys-traffic-nat add destination 172.17.21.11 netmask 255.255.255.255 snatip 172.17.24.1
[ ](https://books.netdev.com.tr/uploads/images/gallery/2022-12/image-1672316296662.png)
After you ping the destination or check the firewall you will see that the traffic is natted.
Wazuh Cheat Sheet
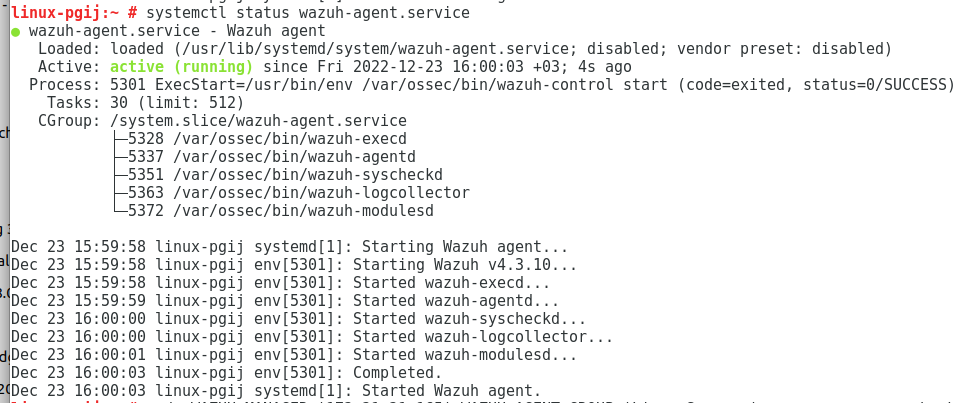
install linux agent on SLES or Opensuse
To install
WAZUH_MANAGER='172.21.21.165' WAZUH_AGENT_GROUP='Linux_Servers' zypper --no-gpg-checks install https://packages.wazuh.com/4.x/yum/wazuh-agent-4.3.10-1.x86_64.rpm
to check
systemctl status wazuh-agent.service
output
Gns3 as a daemon on 22.04
Kullanıcı ekliyoruz
sudo adduser gns3
Gerekli python libraryler
sudo apt install python3-setuptools python3-aiohttp python3-psutil python3-jsonschema git -y
Tutundurma süreci
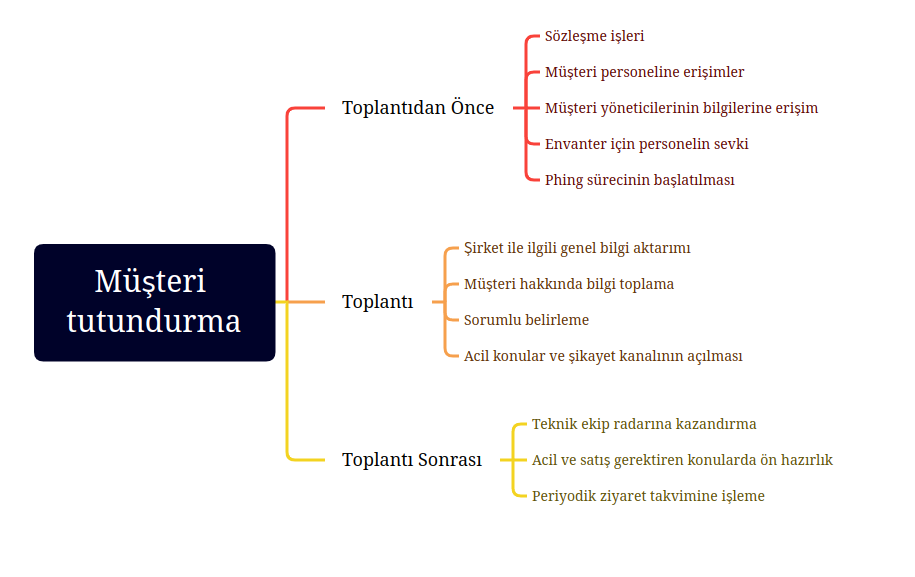
Toplantı öncesi bitmesi gerekenler
- Sözleşmeler gönderilir (Hizmet ve Gizlilik Sözleşmesi)
- Tüm çalışanlarının mail adresleri alınıp ‘’Bilgilendirme’’ maili atılır (OKAN)
- Sistem sorumlusu ve Şirket sahibi/Genel müdür bilgileri öğrenilir.
- Envanter için personel gönderilir ve detaylı envanter çıkarılır. Envanter alınırken sistem analizi ön çalışması yapılır.
- Mutlaka Android telefon ile PHING kaydı alınır. Kritik önemdeki şifreler random pass yöntemi ile hemen değiştirilir.
Tanışma toplantısı
-
Sistem sorumlusu ve veya Genel Müdür seviyesinde randevu talep edilir ve aşağıdaki konular görüşülür.
1.1 Değerleme/analiz çalışması için ikinci ziyaret yapılır. (Müşteri ilişkileri yöneticisi) 1.2 İş Kritik saat ve günler öğrenilir - En yoğun günleriniz hangileridir - 1.3 İş Kritik sistemlerin duruşa - Asla durmaması gereken sistemleriniz nelerdir - 1.4 Tek nokta problem analizi yapılır - sadece 1 adet sunucumu var ? firewall sadece 1 tane mi ?- 1.5 Dışarıdan erişim politikaları öğrenilir -SSL vpn kullanıyormusunuz ?- 1.6.En sık yaşanılan sıkıntılar konusunda bilgi talep edilir -En sık yaşadığınız problem nedir- 1.7 Sık yaşanan konular için akla gelen çözümler var ise basitçe sıralanır, case olarak üretmek üzere toplantı sonrası adımlarında kullanılır 1.8 Şirketimizin geçmişinden sayılarla örnekler verilir a. Kısa tarihçe anlatılır - şu kadar yıldır varız, şu kadar kişiyiz - b. Haftalık case ve çözülen iş sayısı söylenir c. 2.000 problem çözdük, 1800 işi tam zamamnında 150 işi yarı gecikmeli yaptık şeklinde istatistik verilir -
Müşteri den Yesis yetkilisi ataması yapılması istenir.
 6.1 Şirket bilgisayarından mutlaka Yesis login olduğu görülür
 6.2 Yesis konusunda kısaca bilgilendirilir.
Toplantı sonrası yapılması gerekenler
-
Müşteriye, yesiscrm.net/mustericm paneli açılır
6.3 İlk case oluşturması sağlanır. bu adında sık yaşanan problemler aşamasında alınan notlar kullanılır 6.4 Önceden haber verilen ekibin case'e hızlı dönmesi sağlanır 6.5 Bu konuda teşvik edici sözler söylenir -Ekran üzerinden yapılan işlemler hızlı dönüş sürecini başlatır- -
Teknik personellerin zabbix kayıt işlemleri kontrol edilir.
-
Tespit edilen noksanlıklar raporlanır;
-
Alınması gereken tedbirler ve çözümler oluşturulur.
-
Gerekirse tedbir veya çözümlerin üretilmesi için teklifler oluşturulur.
-
Sistem analizi ve diagram ile birlikte müşteri sunuma gidilip eksikleri ve son durumu iletilir.
-
Sunum toplantısından sonra risk analiz raporunda tespit edilen acil durum çözümleri için teklif iletilmesi sağlanır(satış personeli)
-
2 ayda 1 Periyodik memnuniyet ziyareti takvimi oluşturulur (Müşteri ilişkileri Yöneticisi)
SDS
1. Bölüm
Storage Nedir
Diskler, cdler, usb stickler, floppy veri yazdığımız her media bir storage dır. bunları birşekilde birleştirip kocaman veri ambarları yapıyoruz, bunlara da depolama çözümü deniyor yani storage solution. Bunların donanım şeklinde çalışanı var yazılım şeklinde çalışanı var. Fiyat/performans hesabına göre trendyol gibi bir skalada donanımsal çözümün hem finansal hemde politik bazı kötü sonuçları oluyor bu sebeple yazılım tabanlı depolama çözümleri kullanmak daha doğru oluyor.
Software defined storage nedir
Yazılım tanımlı depolama, depolama yazılımını donanım platformundan ayırarak depolama kaynaklarını soyutlayan bir depolama mimarisidir. Bu sayede daha büyük esneklik, verimlilik ve ölçeklenebilirlik elde edilir. openstack in support ettikleri:
- ceph
- iscsi
- local
- Prorprietary, üreticilerin geliştirdikleri diğer lisanslı çözümler.
Bizim openstack teki hangisidir ?
Block storage için Ceph'in mimic versiyonu kullanıyoruz. Ana storage seçimimiz bu.
Biraz rakam verelim şu andaki büyüklüğü vs vs
- 66 adet disklerle dolu sunucudan oluşuyor, sata platform üzerin ssd diskler kullanıyoruz
- xx petabbytetır salona sunucu ekleyebildiğimiz sürece büyür.
Bunları neden anlatıyoruz ?
B ir sonraki slayta io konuştuktan sonra bağlayacağız
2. Bölüm
IO nedir
Yazma ve okuma isteklerinin tamamına denir, en önemli parametresi gecikme takip eden parametre ise süratidir ve iops değeri ile ifade edilir.
Bizim ceph üzerinden verdiğimiz io rate nedir ve neden böyledir
Excel üzerinden gösterelim
Bağlayalım
- database / nosql gibi IO bağımlı uygulamalarda kullanmak sorun olabiliyor.
3. Bölüm
Sorun dan bahsettik, cevabımız "Ephemeral" nedir ?
Sözlük anlamı geçiçi geçici çünkü hostu yada diski kaybedersek buna cevabımız bazen biraz beklemek, bazen de yeni makina vermek olabiliyor.
Ne zaman kullanmalıyız ?
-
io intensive işler için
-
bir cluster sayesinde datanın applikasyon üzerinden yedeklendiği durumlarda
-
ephemeral ve ceph arasındaki farkın fio ile gösterimi
4. Production daki etkisi
-
Can soysal ile yaptığımız 2. testteki çıktı
-
iki farklı makinadaki fio çıktısı
-
iki farklı makinadaki pgbench çıktısı
-
Fark chartı gösterelim
-
limitler
-
Prod da kullandığımızda nelere dikkat edilmelidir
5. Bölüm
- Soru cevap
Nopasswd the user

On ubuntu 22.04
to add your current user to passwordless sudo
echo "useradmin ALL=(ALL) NOPASSWD: ALL" > /etc/sudoers.d/useradmin
Freeradius 2fa with ldap and google
root@zabbix:/usr/local/etc/raddb/sites-enabled# more my_server
server my_server {
listen {
        type = auth
        ipaddr = *
        port = 1812
}
authorize {
        filter_uuid
        filter_google_otp
        ldap
        if (ok || updated)  {
        update control {
        Auth-Type := LDAP
        }
        }
}
authenticate {
        Auth-Type LDAP {
                ldap
        }
}
}
ldap conf
ldap {

    identity = 'CN=freeradius_svc,OU=Service_accounts,DC=migrosonline,DC=com'
    password = 'Cumartesi2023.'


    base_dn = 'OU=ADoutVPNusers,DC=migrosonline,DC=com'

    user {
         base_dn = 'OU=ADoutVPNusers,DC=migrosonline,DC=com'
         filter = "(sAMAccountName=%{%{Stripped-User-Name}:-%{User-Name}})"
         control:My_Group = 'memberOf'
         }


  }
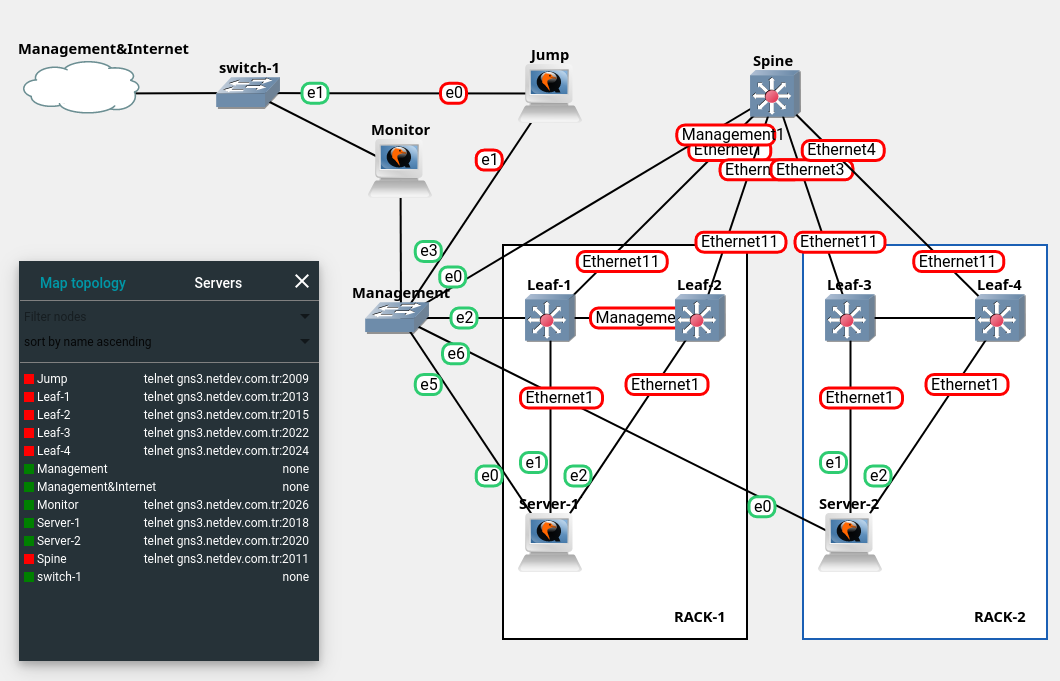
Bgp Evpn vxlan Case Documentation
This is a lab to test your bgp/evpn/vxlan skills, You have 15 business days to finish this.
The case will be reviewed at a remote meeting session upon your declaration about golden tickets. No manual config is allowed, everything should be deployed using ansible-playbooks
You can access the lab at:
http://gns3.eclit.cloud:3080
You have to inform Eclit network team using e-mail opr-network@eclit.com before you start working, lab will be ready approximately 30 minuters after receving a confirmation e-mail from eclit.
There are other labs available, you will use the one with the name "your_name_network_case_eclit"
Facts
-
Accessing the jump and monitor,
Warning !!! Internet facing instances, please do not forget to change password of ubuntu user
Jump server: ssh: gns3.eclit.cloud:2222 user pass ubuntu:ubuntu https: gns3.eclit.cloud:2443 http: gns3.eclit.cloud:2080 Monitor : ssh: gns3.eclit.cloud:3222 user pass ubuntu:ubuntu https: gns3.eclit.cloud:3443 http: gns3.eclit.cloud:3080 Monitor management ip address : 192.168.10.250 -
All ports except the managements ones are shut, be carefull, you can loop and loose the lab access
-
Network devices addressing
- Spine management address : 192.168.10.11 - Leaf-1 management address : 192.168.10.21 - Leaf-2 management address : 192.168.10.22 - Leaf-3 management address : 192.168.10.23 - Leaf-4 management address : 192.168.10.24 -
Leaf pairs are paired with dual links
-
switch username, password : admin:admin
-
Lab switches are Model Arista 4.26.0F vm instances
-
Ansible galaxy collection for arista documentation https://galaxy.ansible.com/ui/repo/published/arista/eos/
-
installation ansible-galaxy collection install arista.eos
Scenario
You will need to deliver the requirements listed below
- Create a public github repository and by using branches develop the following task entries/features
- Create a README.MD file with your details and some explanation about this lab
- Push
Using ansible playbooks:
-
branch clos: Define a bgp/evpn clos topology
you are free to chose between unnumbered/static addressing
-
branch mlag: Define MLAG/ESI.
you are free to chose static or dynamic configuration and opting between ESI/MLAG
-
branch vlan: Define a vlan
-
branch userports: set ethernet1 ports as access members of defined vlan
-
branch telemetry: set monitoring details, credentials, descriptions
Monitoring:
- Create a monitoring solution for this structure on jump server. Snmp is good, other solutions are preferred.
Golden tickets:
- vcs machines should be able to ping each other on same vlan between racks.
- A monitoring solution, it must update the operator about thresolds and outages. These updates must happen less than a minute when any sensor triggers.
- A solution brief, one pager.
100 kb over 20ms delayed link with smbv3
SMBv3 is a more complex protocol than a simple TCP file transfer, with additional overhead for headers, encryption, and other features like window scaling, pipelining, and multi-channel transfers. To adjust our calculations for SMBv3, we need to factor in this overhead. Let's break this down:
- Overhead for SMBv3
SMBv3 adds protocol headers to each packet. The typical overhead for SMBv3 can range from 60 to 100 bytes per packet depending on the specific implementation, encryption, and other factors. We’ll use a conservative estimate of 100 bytes of overhead per packet (this includes SMBv3, TCP, and IP headers).
Thus, the effective payload size of each packet will be reduced from the MTU size of 1470 bytes: Effective Payload=1470 bytes−100 bytes=1370 bytes Effective Payload=1470bytes−100bytes=1370bytes 2. Number of Packets Required (with Overhead)
Now we calculate how many packets are needed to transfer the 100 KB file using this reduced payload size: Number of Packets=File SizeEffective Payload=102,400 bytes1370 bytes/packet≈74.82 packets Number of Packets=Effective PayloadFile Size=1370bytes/packet102,400bytes≈74.82packets
Rounding up, we need 75 packets. 3. SMBv3 Overhead on Transfer Efficiency
SMBv3 also uses pipelining and window scaling to improve efficiency, reducing the need for an RTT for every packet. Let's assume a window size of 10 packets (which is typical for SMBv3 with good pipelining).
For every window, we send 10 packets and wait for 1 RTT for acknowledgment. 4. Total Number of RTTs
Now calculate the number of RTTs based on the window size: Total RTTs=Total PacketsWindow Size=7510=7.5 RTTs Total RTTs=Window SizeTotal Packets=1075=7.5RTTs
Since we can't have a fraction of an RTT, we round up to 8 RTTs. 5. Round-Trip Time (RTT)
We already know the RTT for this link is 40 ms or 0.04 seconds. 6. Total Transmission Time with SMBv3 Overhead
The total transmission time will be: Total Transmission Time=Total RTTs×RTT=8×0.04 seconds=0.32 seconds Total Transmission Time=Total RTTs×RTT=8×0.04seconds=0.32seconds 7. Additional Overhead and Processing Time
We’ll assume 10% additional time for other processing overheads in SMBv3 (e.g., encryption, decryption, and internal protocol processing).
Thus, the final expected time becomes: Final Expected Time=0.32 seconds×1.10=0.352 seconds Final Expected Time=0.32seconds×1.10=0.352seconds 8. Conclusion
The expected copy duration for a 100 KB file over a 1470-byte MTU, 20 ms delay link, using SMBv3 (with typical overhead) is approximately 0.352 seconds or 352 milliseconds.
This takes into account SMBv3 protocol overhead, pipelining, and processing time.
ETL as a service
- Olabilir
- daha kolay çıkar
Workflow as a service
- me too sorunu
- çok adam / gün
- Olmayan birşey mi
- sürdürülebilir
- yıkıcı mı ?
- çok kanal ve coder çıkıyor.
- https://www.jobrouter.com/en/
Citrix Automated Reporting
Code to create automated citrix acceptance reports
import requests
import json
from requests.auth import HTTPBasicAuth

# Citrix VPX credentials and Nitro API endpoint
citrix_vpx_url = 'https://<citrix-vpx-ip>/nitro/v1/config/'
username = '<your-username>'
password = '<your-password>'
auth = HTTPBasicAuth(username, password)

# Disable SSL warnings for self-signed certificates
requests.packages.urllib3.disable_warnings()

# Function to get data from the Nitro API
def get_data_from_vpx(endpoint):
    url = citrix_vpx_url + endpoint
    response = requests.get(url, auth=auth, verify=False)
    if response.status_code == 200:
        return response.json()
    else:
        print(f"Failed to fetch {endpoint}: {response.status_code}")
        return None

# Fetch system-level details
def get_system_report():
    system_info = get_data_from_vpx('nsconfig')
    if system_info:
        ns_ip_address = system_info['nsconfig'][0].get('IPAddress', 'N/A')
        hostname = system_info['nsconfig'][0].get('hostname', 'N/A')
        ha_status = system_info['nsconfig'][0].get('hacurstatus', 'N/A')
        print(f"System IP Address: {ns_ip_address}")
        print(f"Hostname: {hostname}")
        print(f"HA Status: {ha_status}\n")

# Fetch and classify backend health status for virtual servers, also calculate health score
def get_load_balancer_report():
    lb_vservers = get_data_from_vpx('lbvserver')
    if lb_vservers:
        print(f"Load Balancing Virtual Servers:\n{'-'*30}")

        # Separate servers by health status
        perfect_servers = []
        degraded_servers = []
        down_servers = []

        # Counters for health score calculation
        total_servers = 0
        perfect_count = 0
        degraded_count = 0

        for vserver in lb_vservers['lbvserver']:
            name = vserver.get('name', 'N/A')
            ip = vserver.get('ipv46', 'N/A')
            state = vserver.get('curstate', 'N/A')
            total_servers += 1

            # Fetch backend service health status
            services_bound = get_data_from_vpx(f'lbvserver_service_binding/{name}')
            if services_bound:
                backend_health = {'perfect': True, 'degraded': False}
                for service in services_bound.get('lbvserver_service_binding', []):
                    service_name = service.get('servicename', 'N/A')
                    service_health = get_data_from_vpx(f'service/{service_name}')
                    if service_health:
                        health_status = service_health['service'][0].get('svrstate', 'N/A')
                        if health_status == 'DOWN':
                            backend_health['perfect'] = False
                            backend_health['degraded'] = True
                        elif health_status != 'UP':
                            backend_health['perfect'] = False

                if backend_health['perfect']:
                    perfect_servers.append(f"Name: {name} | IP: {ip} | State: {state}")
                    perfect_count += 1
                elif backend_health['degraded']:
                    degraded_servers.append(f"Name: {name} | IP: {ip} | State: {state}")
                    degraded_count += 1
                else:
                    down_servers.append(f"Name: {name} | IP: {ip} | State: {state}")
            else:
                down_servers.append(f"Name: {name} | IP: {ip} | State: {state}")

        # Print out categorized servers
        print("Perfect (Green) Servers:\n" + "-" * 30)
        for server in perfect_servers:
            print(server)
        print("\nDegraded (Yellow) Servers:\n" + "-" * 30)
        for server in degraded_servers:
            print(server)
        print("\nDown (Red) Servers:\n" + "-" * 30)
        for server in down_servers:
            print(server)
        print('\n')

        # Calculate overall health score
        total_degraded = degraded_count * 0.5
        total_health_contrib = perfect_count + total_degraded
        overall_health_score = (total_health_contrib / total_servers) * 100 if total_servers > 0 else 0

        print(f"Overall Health Score: {overall_health_score:.2f}%\n")

# Fetch SSL certificate details, including expiration dates
def get_ssl_report():
    ssl_certificates = get_data_from_vpx('sslcertkey')
    if ssl_certificates:
        print(f"SSL Certificates:\n{'-'*30}")
        for cert in ssl_certificates['sslcertkey']:
            cert_name = cert.get('certkey', 'N/A')
            cert_alias = cert.get('cert', 'N/A')
            exp_date = cert.get('expirymonitor', 'N/A')  # This field might vary depending on your Citrix version
            print(f"Cert Name: {cert_name} | Alias: {cert_alias} | Expiry Date: {exp_date}")
        print('\n')

# Fetch high availability details
def get_ha_report():
    ha_status = get_data_from_vpx('hanode')
    if ha_status:
        print(f"High Availability Details:\n{'-'*30}")
        for node in ha_status['hanode']:
            node_id = node.get('id', 'N/A')
            node_state = node.get('state', 'N/A')
            print(f"Node ID: {node_id} | State: {node_state}")
        print('\n')

# Main function to generate the report
def generate_report():
    print("Citrix VPX High-Level Report\n")
    get_system_report()
    get_load_balancer_report()
    get_ssl_report()
    get_ha_report()

if __name__ == '__main__':
    generate_report()
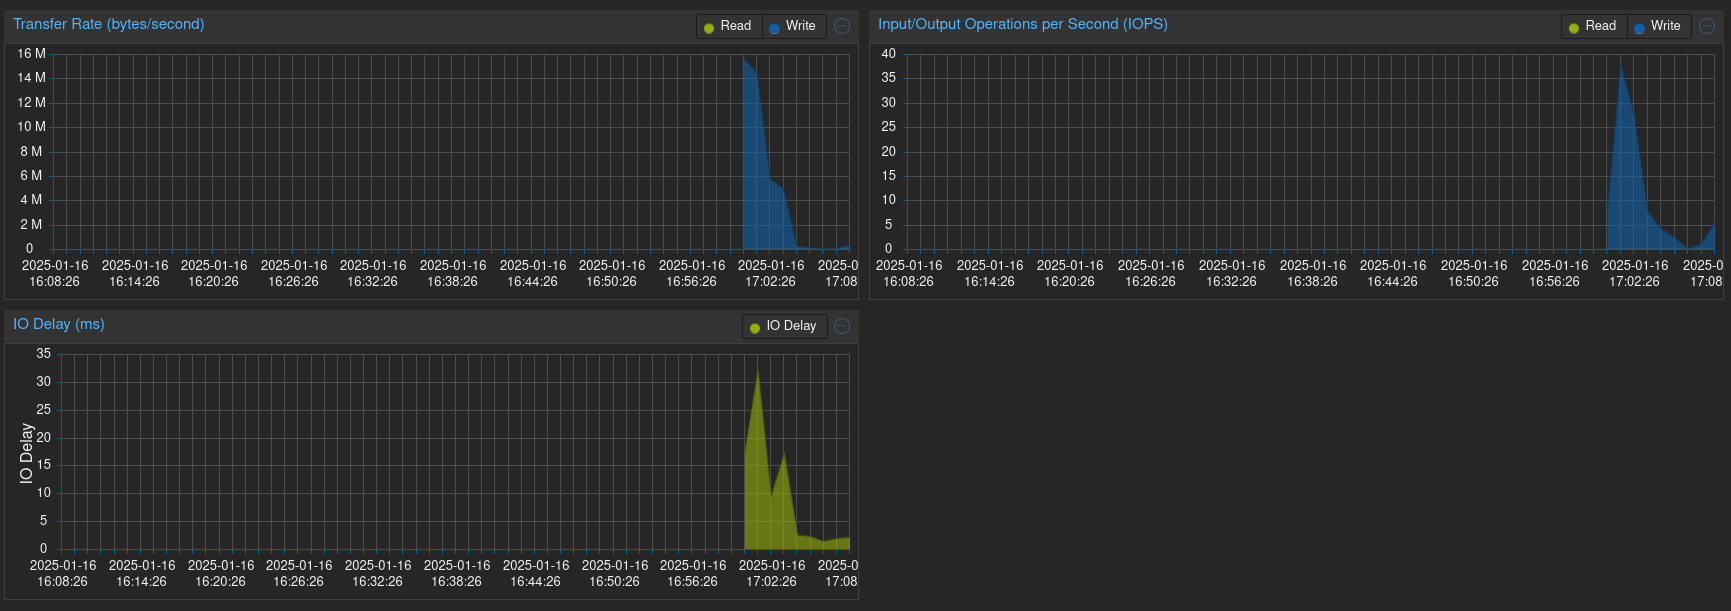
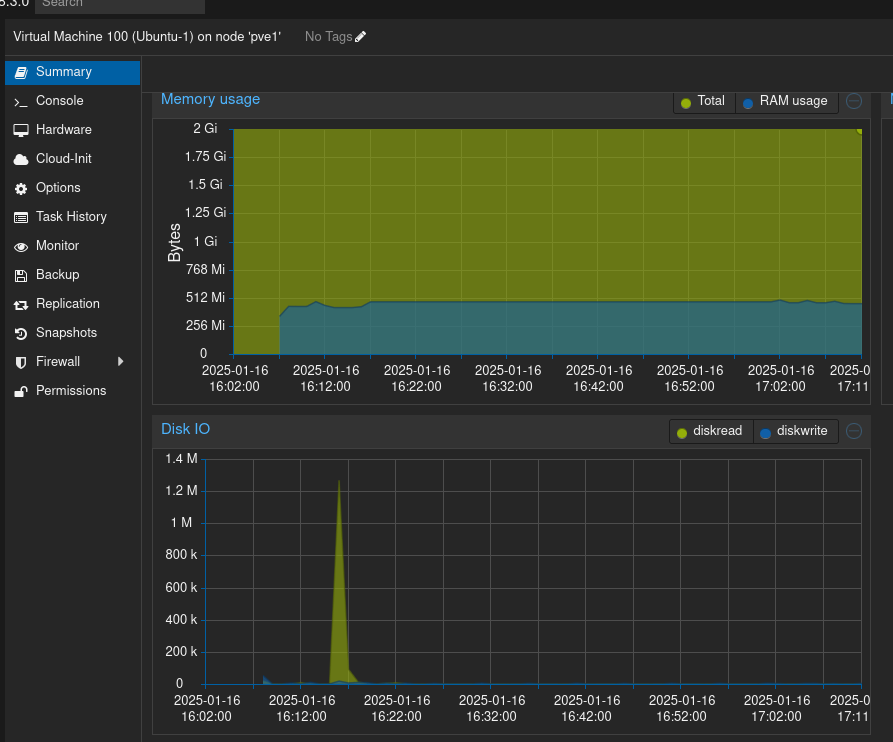
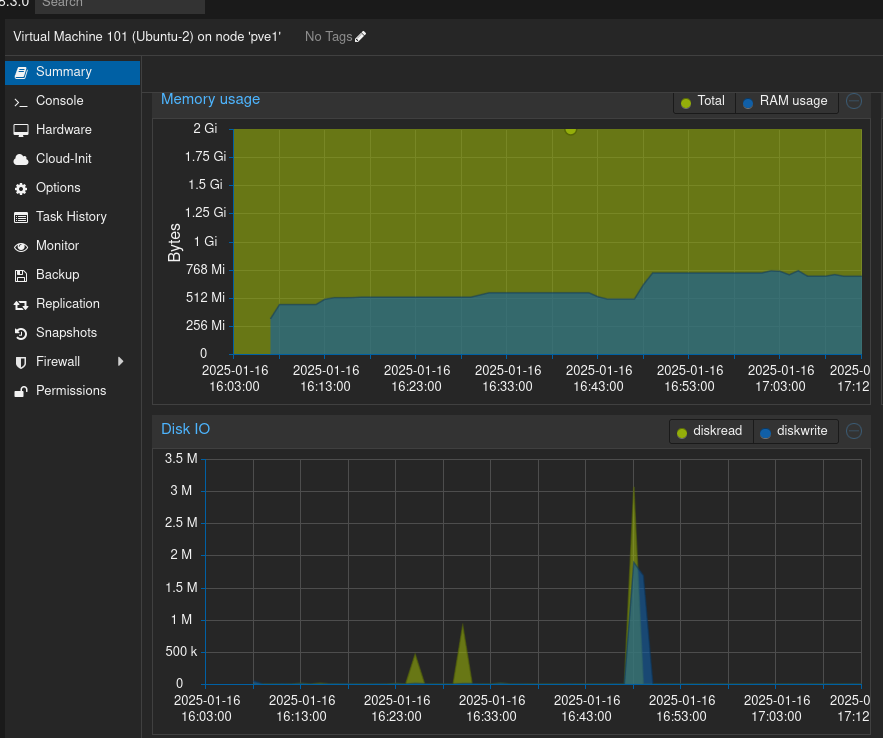
PBS Tests
Baseline
- PBS vm olarak ikinci hostta tek başına
- 300G backup lun PBS'e /backups foldera ext4 olarak mount
- pve1 den 3 adet 50g ubuntu aldık
- 3 test yaptık
- son iki testte storage cache olduğunu tahmin ettiğimiz için ilk hiti göremedik.
Delay
Data aşağıkdaki gibi
vm1 için
vm2 için
vm3 için
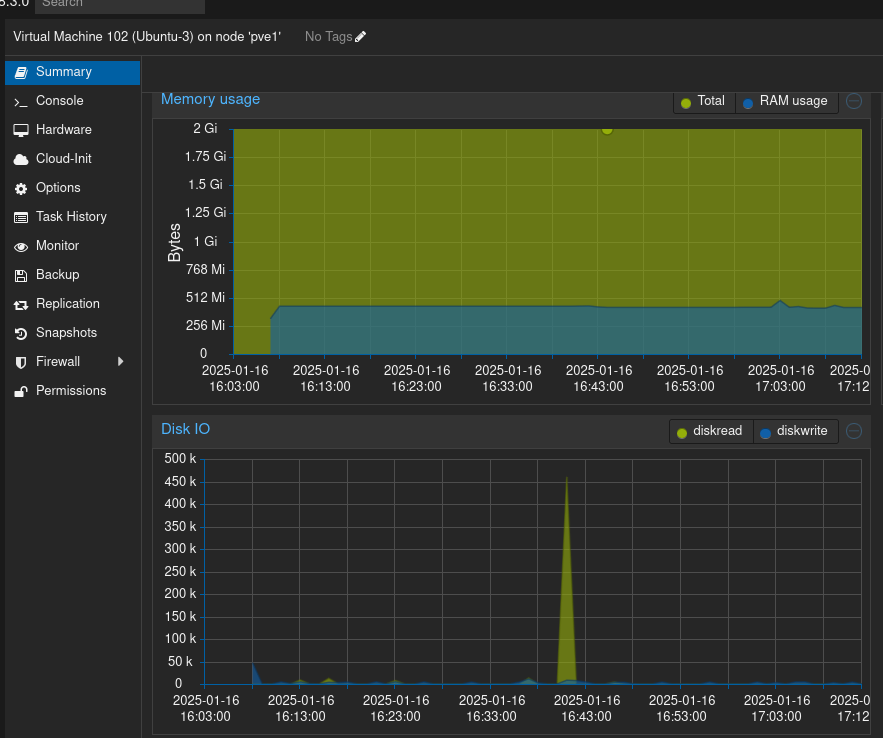
Hammerdb çalışırken
NE assesement
| Layer | Question | Best Answer | Explanation |
|---|---|---|---|
| 1 - Physical | What are the differences between single-mode and multi-mode fiber in terms of distance and bandwidth? | Single-mode fiber (SMF) supports longer distances (up to 40 km) using a small core and a laser light source, while multi-mode fiber (MMF) is limited to shorter distances (typically up to 550m) using an LED light source. | SMF is preferred for long-haul and metro networks, whereas MMF is used in short-range applications like data centers. |
| 1 - Physical | How does signal attenuation affect network performance, and how can you mitigate it in fiber and copper cabling? | Signal attenuation weakens signals over distance. In copper, use repeaters or shorter cables. In fiber, use higher-quality optics and proper splicing. | Attenuation leads to packet loss and slower speeds; fiber is less prone to interference than copper. |
| 2 - Data Link | What is the difference between VLANs and VXLANs, and how do they impact network segmentation? | VLANs segment Layer 2 traffic within a local network, while VXLANs extend Layer 2 segments over Layer 3 using encapsulation (UDP port 4789). | VXLANs allow scalability beyond traditional VLANs (4094 limit) and support multi-tenant cloud environments. |
| 2 - Data Link | Explain how Spanning Tree Protocol (STP) prevents network loops and describe one alternative protocol that can replace STP. | STP detects and disables redundant links to prevent loops, using a root bridge election. Alternative: RSTP (Rapid STP) provides faster convergence, or TRILL/SPB eliminates the need for STP by using shortest-path forwarding. | Without STP, broadcast storms can cripple networks. Modern alternatives improve convergence and efficiency. |
| 3 - Network | How does BGP determine the best route to a destination, and what factors can influence its decision? | BGP selects the best path using attributes like AS-Path (shortest route wins), Local Preference (higher is better), MED (lower is preferred), and Next-Hop reachability. | BGP is a path-vector protocol used for inter-domain routing and is critical for internet and ISP-level routing. |
| 3 - Network | Explain the difference between NAT, PAT, and how they impact IPv4 addressing in a corporate environment. | NAT (Network Address Translation) maps private IPs to a public IP; PAT (Port Address Translation) allows multiple private IPs to share one public IP using port numbers. | PAT is widely used in enterprises to conserve public IPs, enabling many devices to access the internet using a single IP. |
| 4 - Transport | Compare and contrast TCP and UDP. In what scenarios would you choose one over the other? | TCP is reliable (error checking, retransmissions) and used for HTTP, SSH, etc. UDP is faster but unreliable, used for VoIP, DNS, and video streaming. | TCP is preferred for critical applications, while UDP is used when low latency is required. |
| 4 - Transport | Explain the significance of the TCP three-way handshake and how it impacts security vulnerabilities such as SYN floods. | The handshake (SYN → SYN-ACK → ACK) establishes a connection. SYN flood attacks exploit this by sending repeated SYNs without completing the handshake. | Firewalls and SYN cookies can help mitigate SYN flood attacks by preventing resource exhaustion. |
| 5 - Session | How does SSL/TLS establish a secure session between a client and a server? | It uses asymmetric encryption for key exchange (handshake) and symmetric encryption for data transfer (AES, ChaCha20). | TLS ensures confidentiality, integrity, and authentication using certificates (X.509). |
| 5 - Session | What is the role of session persistence (sticky sessions) in load balancing, and how does it affect performance? | It ensures requests from the same client go to the same backend server, improving user experience. | While helpful for stateful applications, it can cause uneven load distribution if not managed properly. |
| 6 - Presentation | How do encryption and compression impact network performance at the presentation layer? | Encryption secures data but increases CPU usage. Compression reduces data size, improving transmission speeds. | Balancing security (encryption) and efficiency (compression) is key in optimizing network performance. |
| 6 - Presentation | Explain the difference between Base64 encoding and actual encryption. In what scenarios would you use each? | Base64 encodes data for safe transport but is reversible. Encryption (AES, RSA, etc.) secures data by making it unreadable without a key. | Use Base64 for data encoding (e.g., email attachments). Use encryption for security (e.g., passwords, confidential data). |
| 7 - Application | What are the differences between HTTP/1.1, HTTP/2, and HTTP/3 in terms of performance and security? | HTTP/1.1 uses sequential requests; HTTP/2 introduces multiplexing and header compression; HTTP/3 uses QUIC for lower latency and better security. | HTTP/3 improves web performance by reducing round-trip delays and mitigating TCP head-of-line blocking. |
| 7 - Application | How does DNS caching work, and what are the security risks associated with DNS cache poisoning? | DNS caching stores query results locally to speed up lookups. Cache poisoning injects malicious IP mappings into caches, redirecting users to fraudulent sites. | Mitigations include DNSSEC (signing records) and validating responses to prevent tampering. |
| 7 - Application | What is the role of an API gateway in modern cloud networking, and how does it impact microservices architectures? | It manages API traffic, enforcing authentication, rate limiting, and load balancing for microservices. | API gateways help decouple services, improve security, and enable scalable architectures. |
System Requirements Specification (SRS)
Project: Layer 2 Data Center Extender (L2 DCE)
Version: 1.0
Date: 29/04/2025
Author: Mesut Bayrak
1. Introduction
1.1 Purpose
Describe the purpose of the L2 DCE system (e.g., extend VLANs across data centers with low latency).
1.2 Scope
Define what the L2 DCE will and will not do.
1.3 Definitions, Acronyms, and Abbreviations
- L2 DCE – Layer 2 Data Center Extender
- VXLAN – Virtual Extensible LAN
- DC – Data Center
- BGP EVPN – Border Gateway Protocol Ethernet VPN
- MAC – Media Access Control
1.4 References
List applicable RFCs, whitepapers, standards.
1.5 Overview
Brief description of document structure.
2. Overall Description
Main purpose of the device is to provide a transparent Layer-2 connectivity between two separate sites.
2.1 Product Perspective
Device can have two distinct operational units to be located in two sites. One central unit (an aggragator), and one (or more) remote site unit(s).
Central unit is intended to be located in a data-center facility with proper power and cooling.
Remote side units are intended to be located inside out-of-reach facilities, via some rental or sale agreement.
Describe how L2 DCE fits into the current system (optional: diagram).
2.2 Product Functions
Function Definition:
- Device will be Ethernet (802.3) based only.
- Extend Layer 2 VLANs transparently between two sites which has only IPv4 connectivity in between.
- The data transfer in between the two sites must be encrypted.
- Device will have two deterministic functional zones: WAN side (where the connection between sites are) and LAN side (where the VLANs to be carried over will be defined).
- Device will not learn and/or filter any Ethernet MAC addresses on either side.
- Device will not interfere, or contribute to any loop prevention algorithms (like spanning tree, SLPP, etc) so that it will not require any extra configuration on any connected devices. Any measures of loop prevention will be handled outside of the device context.
- Device must provide a mechanism for high availability. HA of ports on each side, HA of particular hardware conponents like power supplies, HA of the device itself will be described further as addendum
- Device must be able to perform VLAN number translation, at least on the central site.
- Device will have no OSI Layer-3 interaction with the transferred VLANs (example: Device will have no ip addresses and will not need an IP address on the transferred VLANs).
- If WAN side has Jumbo frames available, system should allow for higher MTU on LAN side. For regular (1500bytes) MTU on WAN side, LAN side will be restricted with .... bytes MTU size (will be decided based on encap method selected)
Operational Definition:
- Deivce must have a Lights-Out Management facility in case it loses all configuration, or not able to boot.
- Configuration of Central unit can be done using a menu based script or GUI
- Basic connectivity configuration (ip address, subnet mask, defgw, dns server) of remote site unit can be done by a menu based script (startup/and or runnable bash script).
- Main configuration of remote site will be downloaded from central site once connectivity is established.
- Remote site device must be able to be altered in configuration, and able to be rebooted from the central side.
2.3 User Characteristics
- Two types of users: System administrators and consumers.
- Sys Admins are network engineers familiar with Layer 2/3 concepts.
- Consumer has no access to the device, or maybe max read-only
2.4 Constraints
- Jumbo frame support required.
- Latency and failover constraints.
2.5 Assumptions and Dependencies
- MPLS/IP backbone in place.
- Network hardware supports VXLAN, EVPN, ECMP.
3. Specific Requirements
3.1 Functional Requirements
| ID | Requirement | Description |
|---|---|---|
| FR-1 | VLAN Extension | Extend VLANs 1–4094. |
| FR-3 | Control Plane | Use BGP EVPN or similar. |
| FR-4 | Failover | To be defined in future |
| FR-5 | MTU Handling | Minimum MTU 9100 bytes. |
3.2 Non-Functional Requirements
| ID | Requirement | Description |
|---|---|---|
| NFR-1 | Availability | 99.99% uptime. |
| NFR-3 | Performance | Latency increase < 2ms one-way. |
4. Interface Requirements
4.1 Hardware Interfaces
- Ethernet interfaces (1G, 10G, 25G, 40G, 100G).
- VXLAN Tunnel Endpoints (VTEPs).
4.2 Software Interfaces
- Standard Linux network stack compatibility.
4.3 Communication Interfaces
- VXLAN over UDP.
5. Performance Requirements
- Max bandwidth: [e.g., 40 Gbps per VTEP].
- Max link utilization: 80%.
6. Security Requirements
- Optional IPsec/MACsec encryption.
7. Other Requirements
- Appliance power limits (e.g., <300W).
8. Appendix
- Network diagrams.
- Failover flowcharts.
- Supported hardware/software matrix.
extender Daemon

Reset usb and enable bluetooth
on a sudo shel
#sudo -i
#echo -n "0000:00:14.0" | sudo tee /sys/bus/pci/drivers/xhci_hcd/unbind
#sleep 2
#echo -n "0000:00:14.0" | sudo tee /sys/bus/pci/drivers/xhci_hcd/bind
it will reset usb hub and the usb bluetooth device will be re-enabled
Cisco Router Automation with Ansible
This repository contains Ansible playbooks and roles for automating VPN tunnel and direct link configurations on Cisco IOS routers across multiple datacenters (EQX, KKB) and AWS connections.
📋 Table of Contents
- Architecture Overview
- Prerequisites
- Quick Start
- Deployment Commands
- Network Topology
- Configuration Structure
- Troubleshooting
🏗️ Architecture Overview
Datacenter Infrastructure
- EQX Datacenter: 2 routers (master/slave) running BGP AS 65401/65402
- KKB Datacenter: 2 routers (master/slave) running BGP AS 65501/65502
- AWS Integration: Direct Connect and IPsec VPN connections
- Fortigate Firewalls: Local firewalls at each datacenter for traffic filtering
Link Types
- IPsec VPN Tunnels: Encrypted tunnels between datacenters and to AWS
- DWDM Direct Links: High-speed fiber optic connections between EQX and KKB
- AWS Direct Connect: Dedicated connections to AWS via IST and FR POPs
- Fortigate Links: BGP peering with local firewalls
📦 Prerequisites
# Python environment (recommended: pyenv + virtualenv)
pyenv virtualenv 3.x routers
pyenv activate routers

# Install Ansible
pip install ansible

# Install required collections (if any)
ansible-galaxy collection install ansible.netcommon
🚀 Quick Start
1. Clone and Setup
cd /path/to/cisco-automation-ansible
pyenv activate routers  # or your Python environment
2. Verify Inventory
# List all routers
ansible -i hosts.ini all_routers --list-hosts

# Test connectivity (dry-run)
ansible -i hosts.ini all_routers -m debug -a 'var=links' --connection=local
3. Deploy a Link
# Deploy specific link to a router
ansible-playbook -i hosts.ini deploy_tunnel.yml \
  --limit eqx-master \
  --extra-vars "link_name=TO-KKB-IPSEC-1"
📊 Deployment Commands by Router
🔹 eqx-master (EQX Master - AS 65401)
# Inter-Datacenter Links
ansible-playbook -i hosts.ini deploy_tunnel.yml --limit eqx-master --extra-vars "link_name=TO-KKB-IPSEC-1"
ansible-playbook -i hosts.ini deploy_tunnel.yml --limit eqx-master --extra-vars "link_name=TO-KKB-DWDM-1"

# Local Firewall
ansible-playbook -i hosts.ini deploy_tunnel.yml --limit eqx-master --extra-vars "link_name=TO-FW-FORTI-1"

# AWS Links
ansible-playbook -i hosts.ini deploy_tunnel.yml --limit eqx-master --extra-vars "link_name=TO-AWS-PROD-IPSEC-1"
ansible-playbook -i hosts.ini deploy_tunnel.yml --limit eqx-master --extra-vars "link_name=TO-AWS-PROD-IPSEC-2"
ansible-playbook -i hosts.ini deploy_tunnel.yml --limit eqx-master --extra-vars "link_name=TO-AWS-PROD-IST-DCON-1"
ansible-playbook -i hosts.ini deploy_tunnel.yml --limit eqx-master --extra-vars "link_name=TO-AWS-PROD-FR-DCON-2"
View as table
| Link Name | Type | Destination | Description |
|---|---|---|---|
| TO-KKB-IPSEC-1 | IPsec VPN | KKB Datacenter | Primary backup tunnel to KKB (prepend 2) |
| TO-KKB-DWDM-1 | Direct/DWDM | KKB Datacenter | High-speed fiber to KKB (primary) |
| TO-FW-FORTI-1 | Direct/BGP | Local Firewall | AS 65001, receives KKB+AWS, distributes EQX |
| TO-AWS-PROD-IPSEC-1 | IPsec VPN | AWS | Primary backup to AWS (prepend 3) |
| TO-AWS-PROD-IPSEC-2 | IPsec VPN | AWS | Secondary backup to AWS (prepend 4) |
| TO-AWS-PROD-IST-DCON-1 | Direct Connect | AWS Istanbul | Direct Connect via Istanbul POP (prepend 1) |
| TO-AWS-PROD-FR-DCON-2 | Direct Connect | AWS Frankfurt | Direct Connect via Frankfurt POP (prepend 2) |
🔹 eqx-slave (EQX Slave - AS 65402)
# Inter-Datacenter Links
ansible-playbook -i hosts.ini deploy_tunnel.yml --limit eqx-slave --extra-vars "link_name=TO-KKB-IPSEC-1"
ansible-playbook -i hosts.ini deploy_tunnel.yml --limit eqx-slave --extra-vars "link_name=TO-KKB-DWDM-1"

# Local Firewall
ansible-playbook -i hosts.ini deploy_tunnel.yml --limit eqx-slave --extra-vars "link_name=TO-FW-FORTI-1"

# AWS Links
ansible-playbook -i hosts.ini deploy_tunnel.yml --limit eqx-slave --extra-vars "link_name=TO-AWS-PROD-IPSEC-1"
ansible-playbook -i hosts.ini deploy_tunnel.yml --limit eqx-slave --extra-vars "link_name=TO-AWS-PROD-IPSEC-2"
ansible-playbook -i hosts.ini deploy_tunnel.yml --limit eqx-slave --extra-vars "link_name=TO-AWS-PROD-IST-DCON-1"
ansible-playbook -i hosts.ini deploy_tunnel.yml --limit eqx-slave --extra-vars "link_name=TO-AWS-PROD-FR-DCON-2"
View as table
| Link Name | Type | Destination | Description |
|---|---|---|---|
| TO-KKB-IPSEC-1 | IPsec VPN | KKB Datacenter | Backup tunnel to KKB (prepend 3) |
| TO-KKB-DWDM-1 | Direct/DWDM | KKB Datacenter | High-speed fiber to KKB (primary) |
| TO-FW-FORTI-1 | Direct/BGP | Local Firewall | AS 65001, receives KKB+AWS, distributes EQX |
| TO-AWS-PROD-IPSEC-1 | IPsec VPN | AWS | Primary backup to AWS (prepend 3) |
| TO-AWS-PROD-IPSEC-2 | IPsec VPN | AWS | Secondary backup to AWS (prepend 4) |
| TO-AWS-PROD-IST-DCON-1 | Direct Connect | AWS Istanbul | Direct Connect via Istanbul POP (prepend 1) |
| TO-AWS-PROD-FR-DCON-2 | Direct Connect | AWS Frankfurt | Direct Connect via Frankfurt POP (prepend 2) |
🔹 kkb-master (KKB Master - AS 65501)
# Inter-Datacenter Links
ansible-playbook -i hosts.ini deploy_tunnel.yml --limit kkb-master --extra-vars "link_name=TO-EQX-IPSEC-1"
ansible-playbook -i hosts.ini deploy_tunnel.yml --limit kkb-master --extra-vars "link_name=TO-EQX-DWDM-1"

# Local Firewall
ansible-playbook -i hosts.ini deploy_tunnel.yml --limit kkb-master --extra-vars "link_name=TO-FW-FORTI-1"

# AWS Links
ansible-playbook -i hosts.ini deploy_tunnel.yml --limit kkb-master --extra-vars "link_name=TO-AWS-PROD-IPSEC-1"
ansible-playbook -i hosts.ini deploy_tunnel.yml --limit kkb-master --extra-vars "link_name=TO-AWS-PROD-IPSEC-2"
ansible-playbook -i hosts.ini deploy_tunnel.yml --limit kkb-master --extra-vars "link_name=TO-AWS-PROD-IST-DCON-1"
ansible-playbook -i hosts.ini deploy_tunnel.yml --limit kkb-master --extra-vars "link_name=TO-AWS-PROD-FR-DCON-2"
View as table
| Link Name | Type | Destination | Description |
|---|---|---|---|
| TO-EQX-IPSEC-1 | IPsec VPN | EQX Datacenter | Primary backup tunnel to EQX (prepend 2) |
| TO-EQX-DWDM-1 | Direct/DWDM | EQX Datacenter | High-speed fiber to EQX (primary) |
| TO-FW-FORTI-1 | Direct/BGP | Local Firewall | AS 65000, receives EQX+AWS, distributes KKB |
| TO-AWS-PROD-IPSEC-1 | IPsec VPN | AWS | Primary backup to AWS (prepend 3) |
| TO-AWS-PROD-IPSEC-2 | IPsec VPN | AWS | Secondary backup to AWS (prepend 4) |
| TO-AWS-PROD-IST-DCON-1 | Direct Connect | AWS Istanbul | Direct Connect via Istanbul POP (prepend 1) |
| TO-AWS-PROD-FR-DCON-2 | Direct Connect | AWS Frankfurt | Direct Connect via Frankfurt POP (prepend 2) |
🔹 kkb-slave (KKB Slave - AS 65502)
# Inter-Datacenter Links
ansible-playbook -i hosts.ini deploy_tunnel.yml --limit kkb-slave --extra-vars "link_name=TO-EQX-IPSEC-1"
ansible-playbook -i hosts.ini deploy_tunnel.yml --limit kkb-slave --extra-vars "link_name=TO-EQX-DWDM-1"

# Local Firewall
ansible-playbook -i hosts.ini deploy_tunnel.yml --limit kkb-slave --extra-vars "link_name=TO-FW-FORTI-1"

# AWS Links
ansible-playbook -i hosts.ini deploy_tunnel.yml --limit kkb-slave --extra-vars "link_name=TO-AWS-PROD-IPSEC-1"
ansible-playbook -i hosts.ini deploy_tunnel.yml --limit kkb-slave --extra-vars "link_name=TO-AWS-PROD-IPSEC-2"
ansible-playbook -i hosts.ini deploy_tunnel.yml --limit kkb-slave --extra-vars "link_name=TO-AWS-PROD-IST-DCON-1"
ansible-playbook -i hosts.ini deploy_tunnel.yml --limit kkb-slave --extra-vars "link_name=TO-AWS-PROD-FR-DCON-2"
View as table
| Link Name | Type | Destination | Description |
|---|---|---|---|
| TO-EQX-IPSEC-1 | IPsec VPN | EQX Datacenter | Backup tunnel to EQX (prepend 3) |
| TO-EQX-DWDM-1 | Direct/DWDM | EQX Datacenter | High-speed fiber to EQX (primary) |
| TO-FW-FORTI-1 | Direct/BGP | Local Firewall | AS 65000, receives EQX+AWS, distributes KKB |
| TO-AWS-PROD-IPSEC-1 | IPsec VPN | AWS | Primary backup to AWS (prepend 3) |
| TO-AWS-PROD-IPSEC-2 | IPsec VPN | AWS | Secondary backup to AWS (prepend 4) |
| TO-AWS-PROD-IST-DCON-1 | Direct Connect | AWS Istanbul | Direct Connect via Istanbul POP (prepend 1) |
| TO-AWS-PROD-FR-DCON-2 | Direct Connect | AWS Frankfurt | Direct Connect via Frankfurt POP (prepend 2) |
🔸 Development Routers
dev-eqx-master
ansible-playbook -i hosts.ini deploy_tunnel.yml --limit dev-eqx-master --extra-vars "link_name=TO-KKB-IPSEC-1"
ansible-playbook -i hosts.ini deploy_tunnel.yml --limit dev-eqx-master --extra-vars "link_name=TO-KKB-DWDM-1"
ansible-playbook -i hosts.ini deploy_tunnel.yml --limit dev-eqx-master --extra-vars "link_name=TO-FW-FORTI-1"
dev-eqx-slave
ansible-playbook -i hosts.ini deploy_tunnel.yml --limit dev-eqx-slave --extra-vars "link_name=TO-KKB-IPSEC-1"
ansible-playbook -i hosts.ini deploy_tunnel.yml --limit dev-eqx-slave --extra-vars "link_name=TO-KKB-DWDM-1"
ansible-playbook -i hosts.ini deploy_tunnel.yml --limit dev-eqx-slave --extra-vars "link_name=TO-FW-FORTI-1"
dev-kkb-master
ansible-playbook -i hosts.ini deploy_tunnel.yml --limit dev-kkb-master --extra-vars "link_name=TO-EQX-IPSEC-1"
ansible-playbook -i hosts.ini deploy_tunnel.yml --limit dev-kkb-master --extra-vars "link_name=TO-EQX-DWDM-1"
ansible-playbook -i hosts.ini deploy_tunnel.yml --limit dev-kkb-master --extra-vars "link_name=TO-FW-FORTI-1"
dev-kkb-slave
ansible-playbook -i hosts.ini deploy_tunnel.yml --limit dev-kkb-slave --extra-vars "link_name=TO-EQX-IPSEC-1"
ansible-playbook -i hosts.ini deploy_tunnel.yml --limit dev-kkb-slave --extra-vars "link_name=TO-EQX-DWDM-1"
ansible-playbook -i hosts.ini deploy_tunnel.yml --limit dev-kkb-slave --extra-vars "link_name=TO-FW-FORTI-1"
🌐 Network Topology
┌─────────────────────────────────────────────────────────────────┐
│                        EQX DATACENTER                           │
│  ┌──────────────┐              ┌──────────────┐                │
│  │ eqx-master   │◄────DWDM────►│ eqx-slave    │                │
│  │ AS 65401     │              │ AS 65402     │                │
│  └──────┬───────┘              └──────┬───────┘                │
│         │                              │                        │
│         │         ┌──────────┐         │                        │
│         └────────►│ Fortigate│◄────────┘                        │
│                   └──────────┘                                  │
└─────────────────────┬──────────────────────────────────────────┘
                      │ IPsec VPN
                      │ DWDM
                      ▼
┌─────────────────────────────────────────────────────────────────┐
│                        KKB DATACENTER                           │
│  ┌──────────────┐              ┌──────────────┐                │
│  │ kkb-master   │◄────DWDM────►│ kkb-slave    │                │
│  │ AS 65501     │              │ AS 65502     │                │
│  └──────┬───────┘              └──────┬───────┘                │
│         │                              │                        │
│         │         ┌──────────┐         │                        │
│         └────────►│ Fortigate│◄────────┘                        │
│                   └──────────┘                                  │
└─────────────────────┬──────────────────────────────────────────┘
                      │
                      │ Direct Connect (IST/FR)
                      │ IPsec VPN
                      ▼
              ┌───────────────┐
              │   AWS Cloud   │
              │  VPC / VGW    │
              └───────────────┘
📁 Configuration Structure
cisco-automation-ansible/
├── ansible.cfg                 # Ansible configuration
├── hosts.ini                   # Inventory file with all routers
├── deploy_tunnel.yml           # Main playbook
├── group_vars/
│   ├── all.yml                # Shared network lists (centralized)
│   ├── eqx_masters.yml        # EQX master router link configs
│   ├── eqx_slaves.yml         # EQX slave router link configs
│   ├── kkb_masters.yml        # KKB master router link configs
│   └── kkb_slaves.yml         # KKB slave router link configs
├── host_vars/
│   ├── eqx-master.yml         # Per-host variables (prod)
│   ├── eqx-slave.yml
│   ├── kkb-master.yml
│   ├── kkb-slave.yml
│   ├── dev-eqx-master.yml     # Per-host variables (dev)
│   ├── dev-eqx-slave.yml
│   ├── dev-kkb-master.yml
│   └── dev-kkb-slave.yml
└── roles/
    └── vpn_tunnel/
        └── tasks/
            ├── main.yml       # Entry point with link selection
            ├── ipsec.yml      # IPsec tunnel configuration
            ├── bgp.yml        # BGP neighbor & routing config
            └── interface.yml  # Interface configuration
Centralized Network Configuration
All network prefixes are defined once in group_vars/all.yml:
- eqx_receive_networks / eqx_distribute_networks: 18 EQX datacenter networks
- kkb_distribute_networks: 13 KKB datacenter networks
- aws_receive_networks: AWS VPC networks (172.16.110.0/24)
- aws_distribute_networks: Networks announced to AWS
- forti_receive_in_eqx / forti_distribute_in_eqx: Combined networks for EQX Fortigate
- forti_receive_in_kkb / forti_distribute_in_kkb: Combined networks for KKB Fortigate
This DRY (Don't Repeat Yourself) approach ensures consistency and easier maintenance.
🔧 Advanced Usage
Deploy Multiple Links
# Deploy all links on a router (use with caution!)
ansible-playbook -i hosts.ini deploy_tunnel.yml --limit eqx-master
Deploy to Multiple Routers
# Deploy same link to all EQX routers
ansible-playbook -i hosts.ini deploy_tunnel.yml \
  --limit eqx_masters \
  --extra-vars "link_name=TO-KKB-IPSEC-1"

# Deploy to both datacenters
ansible-playbook -i hosts.ini deploy_tunnel.yml \
  --limit "eqx-master,kkb-master" \
  --extra-vars "link_name=TO-FW-FORTI-1"
Dry-Run / Check Mode
# Test without making changes
ansible-playbook -i hosts.ini deploy_tunnel.yml \
  --limit eqx-master \
  --extra-vars "link_name=TO-KKB-IPSEC-1" \
  --check
Selective Configuration
Links support per-component deployment flags:
configure:
  bgp: true        # Deploy BGP configuration
  ipsec: true      # Deploy IPsec configuration
  interface: true  # Deploy interface configuration
To skip specific components, set them to false in the link definition.
🐛 Troubleshooting
Common Issues
Issue: "link_name is not defined"
# Solution: Always specify link_name
ansible-playbook -i hosts.ini deploy_tunnel.yml \
  --limit eqx-master \
  --extra-vars "link_name=TO-KKB-IPSEC-1"
Issue: "Unable to connect to router"
# Check SSH connectivity
ansible -i hosts.ini eqx-master -m ping

# Verify credentials in group_vars/all.yml
ansible_user: admin
ansible_password: admin
Issue: "Jinja2 template error"
# Validate configuration syntax
ansible -i hosts.ini eqx-master -m debug -a 'var=links' --connection=local
Debug Commands
# List all configured links for a router
ansible -i hosts.ini eqx-master -m debug -a 'var=links' --connection=local

# Check specific link configuration
ansible -i hosts.ini eqx-master -m debug \
  -a 'var=links[0]' \
  --connection=local

# Verify network lists
ansible -i hosts.ini eqx-master -m debug \
  -a 'var=eqx_receive_networks' \
  --connection=local
Validation
# Validate all routers can render their configurations
ansible -i hosts.ini all_routers -m debug \
  -a 'var=links[0].name' \
  --connection=local | grep SUCCESS
📝 Best Practices
- Always test in dev environment first: Use dev routers before deploying to production
- Deploy one link at a time: Easier to troubleshoot and rollback
- Use version control: Commit changes before deploying to production
- Document changes: Update this README when adding new links or routers
- Backup configurations: Save router configs before making changes
- Monitor BGP sessions: Verify BGP neighbors come up after deployment
🔐 Security Notes
- Credentials are stored in
group_vars/all.yml- ensure proper file permissions (600) - Consider using Ansible Vault for sensitive data:
ansible-vault encrypt group_vars/all.yml - IPsec pre-shared keys should be rotated regularly
- Limit SSH access to Ansible control node only
📊 BGP AS Numbers
| Router | AS Number | Role |
|---|---|---|
| eqx-master | 65401 | EQX Primary |
| eqx-slave | 65402 | EQX Secondary |
| kkb-master | 65501 | KKB Primary |
| kkb-slave | 65502 | KKB Secondary |
| Fortigate (EQX) | 65001 | EQX Firewall |
| Fortigate (KKB) | 65000 | KKB Firewall |
📚 Additional Resources
📄 License
Internal use only - Proprietary
👥 Support
For issues or questions, contact the Network Operations team.
Last Updated: October 2025
Proto Analyzer

pipes
| # | Pipe (Growth Channel) | Market Demand | Profitability | Ease of Execution | Strategic Value | Score (/10) | Why It Matters |
|---|---|---|---|---|---|---|---|
| 1 | Cybersecurity-as-a-Service (MDR, SOC-lite, ZTNA, EDR) | 10 | 9 | 6 | 10 | 8.8 | Exploding demand due to KVKK, cyber insurance, ransomware; Turkish SMBs lack in-house security. |
| 2 | Cloud Migration & CloudOps (AWS, GCP, Azure, Turkcell/DC providers) | 9 | 8 | 7 | 9 | 8.5 | High cloud adoption wave; companies need hybrid/multi-cloud. |
| 3 | Network Modernization & NaaS (SD-WAN, Wi-Fi 6/6E, SASE) | 9 | 8 | 6 | 9 | 8.2 | SD-WAN & secure access demand increasing with remote work + branch connectivity. |
| 4 | Managed Compliance + Audit-readiness (KVKK, ISO 27001, PCI DSS) | 8 | 9 | 7 | 8 | 8.0 | SMEs need compliance but lack expertise; high-margin advisory + recurring managed security. |
| 5 | Automation & AI Ops (RPA, Infra Automation, AIOps for SMEs) | 7 | 9 | 6 | 9 | 7.9 | Turkey’s labor costs rising; automation reduces OPEX, big appeal for mid-market. |
| 6 | Managed IT + Helpdesk (Enterprise-grade for SME market) | 8 | 7 | 8 | 7 | 7.8 | Core MSP offering; still in demand; differentiates on SLAs & automation. |
| 7 | Backup/DRaaS (Cross-datacenter, Azure/Turkcell/Vodafone DR) | 8 | 8 | 7 | 6 | 7.6 | Earthquake risk & new regulations increase DR demand. |
| 8 | Industry-Specific Solutions (Health, Retail, Manufacturing verticals) | 7 | 8 | 6 | 8 | 7.4 | Tailored MSP bundles sell well in Turkish vertical markets. |
| 9 | IoT & Edge Management (Factories, energy, logistics) | 6 | 8 | 5 | 9 | 7.2 | Slow growth but high ROI in industrial zones; strong fit for advanced MSPs. |
| 10 | MSP Co-managed IT (augment internal IT teams) | 6 | 7 | 9 | 7 | 7.1 | Turkish enterprises keep small IT teams; co-managed fills skill gaps. |
Mercanın projeleri
